Using multidimensional arrays in C#
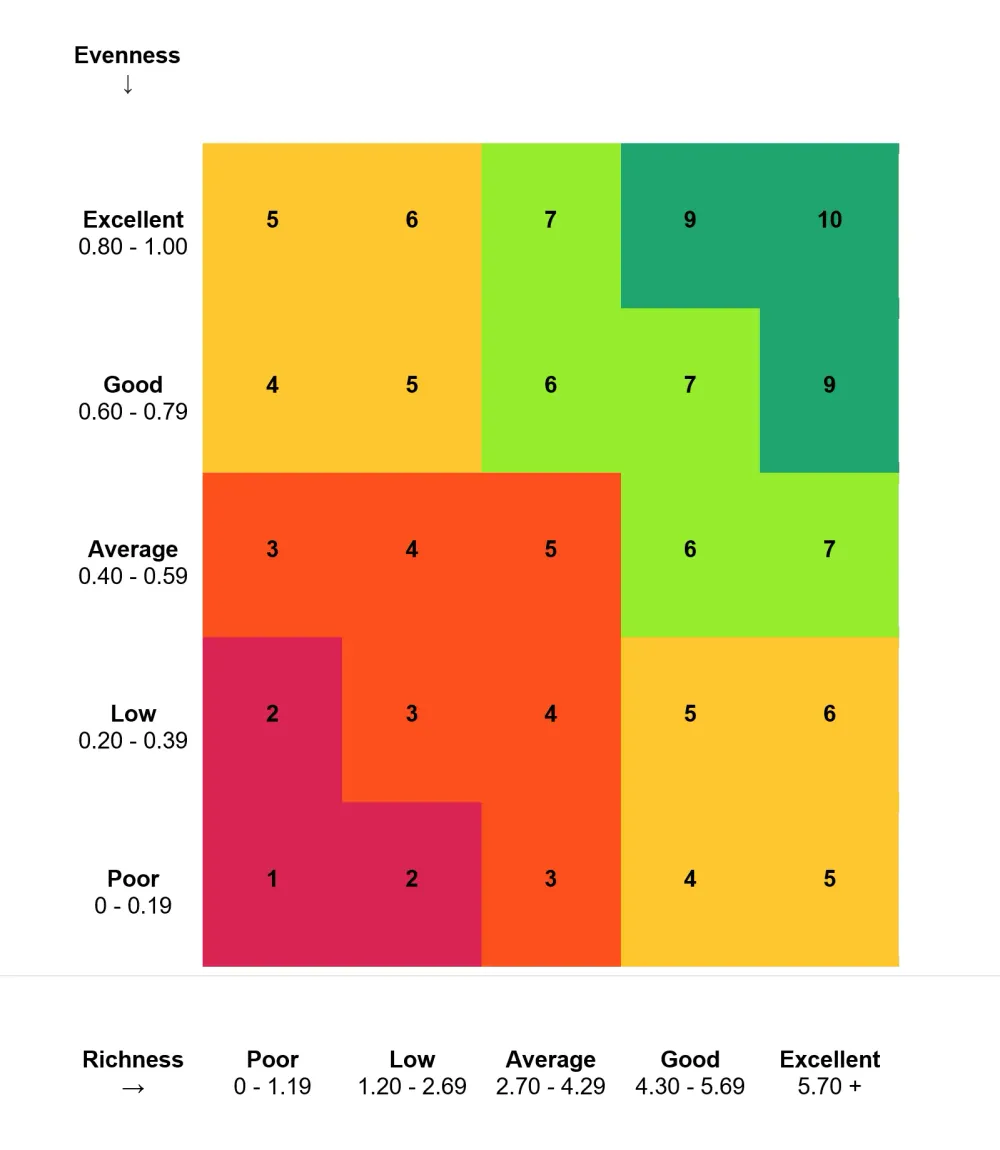
In a recent project with a client, we were presented with this matrix for generating a score based on two different parameters:

A scoring chart based on two different values on the X and Y axes.
I hadn't worked with a scoring system like this before so looked for a way to represent this data well and picking a score based on X and Y values. If it was a simple scale, this would have been much easier. After doing some Googling, I ended up with multidimensional arrays, which I had never used before!
The official C# documentation for multidimensional arrays gives some great basic examples to work from:
// Two-dimensional array.int[,] array2D = new int[,] { { 1, 2 }, { 3, 4 }, { 5, 6 }, { 7, 8 } };// The same array with dimensions specified.int[,] array2Da = new int[4, 2] { { 1, 2 }, { 3, 4 }, { 5, 6 }, { 7, 8 } };As I understood it, you are placing values on the grid based on X and Y position. I mapped out the scores first based on an enum, ScoreEnum, to get the values for the X and Y positions.
ScoreEnum[,] scoring = new ScoreEnum[,]{ { ScoreEnum.Average, ScoreEnum.Average, ScoreEnum.Good, ScoreEnum.High, ScoreEnum.High }, { ScoreEnum.Average, ScoreEnum.Average, ScoreEnum.Good, ScoreEnum.Good, ScoreEnum.High }, { ScoreEnum.BelowAverage, ScoreEnum.BelowAverage, ScoreEnum.Good, ScoreEnum.Good, ScoreEnum.Good }, { ScoreEnum.Poor, ScoreEnum.BelowAverage, ScoreEnum.BelowAverage, ScoreEnum.Average, ScoreEnum.Average }, { ScoreEnum.Poor, ScoreEnum.Poor, ScoreEnum.BelowAverage, ScoreEnum.Average, ScoreEnum.Average }};Based on this scoring variable, I could pick X and Y values as an index and get the score. For example, scoring[2][3] should return ScoreEnum.Good. I also had a second array to store the scores for each X and Y position.
int[,] scores = new int[,]{ { 5, 6, 7, 9, 10 }, { 4, 5, 6, 7, 9 }, { 3, 4, 5, 6, 7 }, { 2, 3, 4, 5, 6 }, { 1, 2, 3, 4, 5 }};This worked first time! But I was getting the wrong number returned for the score. What I failed to realise is that the graph starts from the bottom left, whereas my array needed to start from the top left. Simply reversing the Y values then worked.
ScoreEnum[,] scoring = new ScoreEnum[,]{    { ScoreEnum.Poor,           ScoreEnum.Poor,         ScoreEnum.BelowAverage, ScoreEnum.Average,  ScoreEnum.Average   },    { ScoreEnum.Poor,           ScoreEnum.BelowAverage, ScoreEnum.BelowAverage, ScoreEnum.Average,  ScoreEnum.Average   },    { ScoreEnum.BelowAverage,   ScoreEnum.BelowAverage, ScoreEnum.Good,         ScoreEnum.Good,     ScoreEnum.Good      },    { ScoreEnum.Average,        ScoreEnum.Average,      ScoreEnum.Good,         ScoreEnum.Good,     ScoreEnum.High      },    { ScoreEnum.Average,        ScoreEnum.Average,      ScoreEnum.Good,         ScoreEnum.High,     ScoreEnum.High      }};
int[,] scores = new int[,]{    { 1, 2, 3, 4, 5 },    { 2, 3, 4, 5, 6 },    { 3, 4, 5, 6, 7 },    { 4, 5, 6, 7, 9 },    { 5, 6, 7, 9, 10 }};
int xValue = 2;int yValue = 3;
var scoringValue = scoring[xValue, yValue]; // returns ScoreEnum.Goodvar scoreValue = scores[xValue, yValue]; // returns 6